PHASE DIAGRAM
TITLE:
Determination of Phase Diagram for Ethanol/Toluene/Water
System Theory
OBJECTIVES:
The
objective of this experiment is to
1. Determine the solubility limits in a
ternary system of water and two other liquids (ethanol and toluene), where one
is completely miscible (ethanol) and the other one is partly miscible with water
(toluene).
2. Understand the concept of miscibility and phase diagram for
three-component system.
3. Apply the concept of construction of the solubility curve of
the system studied on a triangular diagram.
4. Understand Phase Rules that relate to
the use of triangular coordinates to know the mutual solubility of liquids in a
two phase system.
DATE OF
EXPERIMENT:
7 November 2016
INTRODUCTION:
While making pharmaceutical
formulation, we need to mix several type of chemicals together to achieve a
homogeneous mixture. To create a homogeneous mixture, exact ratio of each
component needs to be determined, provided some other conditions like temperature
and pressure are known and fixed.
Following the basis of describing
the effect of intensive variable to various phase in a system at equilibrium,
which is the phase rule, it is determined that this system have 4 degrees of
freedom. The four degrees of freedom are - temperature, pressure, and any
two from the three component concentration.
F = C – P + 2
F = 3 – 1 + 2
F
= 4
where F
= degree of freedom
C = number of
components
P = number of phases
In this experiment, three
components are concerned, which are ethanol, toluene and water. When three of
the components are mixed at a correct ratio, homogeneous mixture can be formed
even though toluene is actually partially miscible in water. Since
it is difficult to represent four variables graphically, one variable out of
the four is generally considered constant, the pressure in this experiment is fixed at 1 atm, so the number
of degrees of freedom becomes
three.
At constant pressure and
temperature, the compositions of the three components can be stated in the form
of coordinates in triangular diagram.

Figure 1 shows
the example of a triangular diagram. Triangular diagram is very convenient in
determining the compositions of three components as each corner
of the triangular diagram represents a pure component, which is 100% A, 100% B,
100% C. Meanwhile,
each side of the triangle represents the mixture of two components. For
instance, the side connecting A and B shows the mixture of A and B. Within the
triangle, all three components are shown.
For any line that is parallel to
any side of the triangle, constant percentage of a component is shown. For
example, DE ,which is parallel to BC, shows
20% of A with varying amount of B and C. Also, FG,
which is parallel to AC, shows 30% of B with varying amount of A and C. The
point of intersection of the three parallel lines will show the composition of
each components in a mixture at the instance. For example, K which is the
intersection point of DE, FG and HI shows
that there are 20% A, 50% B and 30% C. It is appropriate to measure in this way
because the sum of all distances from K, which are KI, KC, KE, KH, KG and KD
equals to the length of any one side of the triangle.
The addition of a third component to a pair of miscible liquids, for example when water is added into ethanol and
toluene, their mutual solubility will change. If this third
component is more soluble in one of two different components the mutual
solubility of the liquid pair will decrease. Contrarily, if it is soluble in
both of the liquids, the mutual solubility will increase. The mutual solubility will only increase until the
mixture becomes homogeneous. For example, when ethanol is added to a mixture of
benzene and water, the mutual solubility of the liquid pair increases until it
reached a point whereby the mixture becomes homogeneous.
EXPERIMENTAL METHOD – APPARATUS:
 |
| Conical flask 250mL |
 |
| Pipette pump |
 |
| Pipette 20mL |
 |
| Burette 50mL |
 |
| Retort stand and clamp |
 |
| Dropper |
 |
| Thermometer |
EXPERIMENTAL METHOD – CHEMICALS:
 |
| Ethanol |
 |
| Toluene |
 |
| Distilled water |
EXPERIMENTAL METHOD – EXPERIMENTAL
PROCEDURE:
1. 20 mL of mixtures of ethanol and toluene are
prepared in conical flasks as below according to fixed ratio:
Beaker
|
Percentage of ethanol (%)
|
Percentage of toluene (%)
|
Volume of ethanol (mL)
|
Volume of toluene (mL)
|
A
|
10
|
90
|
2
|
18
|
B
|
25
|
75
|
5
|
15
|
C
|
35
|
65
|
7
|
13
|
D
|
50
|
50
|
10
|
10
|
E
|
65
|
35
|
13
|
7
|
F
|
75
|
25
|
15
|
5
|
G
|
90
|
10
|
18
|
2
|
H
|
95
|
5
|
19
|
1
|
2. Distilled water is titrated into mixture into conical flask A and shaken until
cloudiness (due to the existence of second phase) is
observed.
3. The amount of distilled water titrated is
recorded in the Table 1 below. The room temperature is recorded.
4. Step 2 to step 4 are repeated for conical flask
B, C, D, E, F, G and H.
5. Step 1 to step 5 are repeated for second
measurement. The result of the second titration is recorded in Table 2
below.
6. Average volume of water added into each conical
flask is calculated from the first and second titration.
7. New percentage of each components in the mixture
after titration is recalculated.
8. All results calculated in step 6 and 7 are
tabulated in Table 3.
9. A solubility curve is drawn on a triangular
diagram.
RESULT:
Record all the
results.
Table 1 : First
Titration
Solution
|
Percentage of Ethanol (%)
|
Percentage of Toluene (%)
|
Volume of Ethanol (ml)
|
Volume of Toluene (ml)
|
Volume of Water Titrated ( ml )
|
||
Before
|
After
|
Volume
|
|||||
A
|
10
|
90
|
2
|
18
|
26.2
|
27.4
|
1.2
|
B
|
25
|
75
|
5
|
15
|
27.4
|
28.9
|
1.5
|
C
|
35
|
65
|
7
|
13
|
28.9
|
30.5
|
1.6
|
D
|
50
|
50
|
10
|
10
|
30.5
|
32.5
|
2.0
|
E
|
65
|
35
|
13
|
7
|
32.5
|
35.5
|
3.0
|
F
|
75
|
25
|
15
|
5
|
35.5
|
40.9
|
4.9
|
G
|
90
|
10
|
18
|
2
|
20.4
|
31.5
|
11.1
|
H
|
95
|
5
|
19
|
1
|
19.7
|
36.1
|
16.4
|
Table 2: Second Titration
Solution
|
Percentage of Ethanol (%)
|
Percentage of Toluene (%)
|
Volume of Ethanol (ml)
|
Volume of Toluene (ml)
|
Volume of Water Titrated ( ml )
|
||
Before
|
After
|
Volume
|
|||||
A
|
10
|
90
|
2
|
18
|
5.4
|
6.5
|
1.1
|
B
|
25
|
75
|
5
|
15
|
6.5
|
7.9
|
1.4
|
C
|
35
|
65
|
7
|
13
|
7.9
|
9.6
|
1.7
|
D
|
50
|
50
|
10
|
10
|
9.6
|
11.6
|
2.0
|
E
|
65
|
35
|
13
|
7
|
11.6
|
14.8
|
3.2
|
F
|
75
|
25
|
15
|
5
|
14.8
|
19.5
|
4.7
|
G
|
90
|
10
|
18
|
2
|
19.5
|
30.8
|
11.3
|
H
|
95
|
5
|
19
|
1
|
17.6
|
33.7
|
16.1
|
Table 3:
Solut-ion
|
Titration I
|
Titration II
|
Averege
Volume of Water Titrated ( ml )
|
Total
volume of the solution after titration (ml)
|
Percentage
of Ethanol after titration (%)
|
Percentage
of Toluene after titration (%)
|
Percentage
of Water after titration (%)
|
A
|
1.2
|
1.1
|
1.15
|
21.15
|
9.46
|
85.10
|
5.44
|
B
|
1.5
|
1.4
|
1.45
|
21.45
|
23.31
|
69.93
|
6.76
|
C
|
1.6
|
1.7
|
1.65
|
21.65
|
32.33
|
60.5
|
7.62
|
D
|
2.0
|
2.0
|
2.00
|
22.00
|
45.45
|
45.45
|
9.10
|
E
|
3.0
|
3.2
|
3.10
|
23.10
|
56.28
|
30.30
|
13.42
|
F
|
4.9
|
4.7
|
4.80
|
24.80
|
60.48
|
20.16
|
19.36
|
G
|
11.1
|
11.3
|
11.20
|
31.20
|
57.69
|
6.41
|
35.90
|
H
|
16.4
|
16.1
|
16.25
|
36.25
|
52.41
|
2.76
|
44.83
|
Calculation:
Solution A
Percentage of ethanol =
2 x100%
21.15
= 9.46 %
Percentage of toluene =
18 x100%
21.15
=
85.10 %
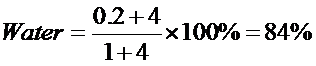
Percentage of water = 100% - 9.46% - 85.10%
= 5.44%
Solution B
Percentage of ethanol =
5 x100%
21.45
= 23.31%
Percentage of toluene = 15
x100%
21.45
= 69.93%
Percentage of water = 100% - 23.31%- 69.93%
= 6.76%
Solution C
Percentage of ethanol = 7 x100%
21.65
= 32.33%
Percentage of toluene = 13
x100%
21.65
= 60.05%
Percentage of
water = 100%
-32.33%-60.05%
= 7.62%
Solution D
Percentage of
ethanol = 10
x100%
22.00
= 45.45%
Percentage of toluene = 10 x100%
22.00
= 45.45%
Percentage of
water = 100%- 45.5%- 45.45%
= 9.10%
Solution E
Percentage of
ethanol = 13
x100%
23.10
= 56.28%
Percentage of toluene = 7 x100%
23.10
= 30.30%
Percentage of
water = 100%- 56.28%-
30.30%
= 13.42%
Solution F
Percentage of
ethanol = 15
x100%
24.80
= 60.48%
Percentage of toluene = 5 x100%
24.80
= 20.16%
Percentage of
water = 100%- 60.48%-
20.16%
= 19.36%
Solution G
Percentage of
ethanol = 18
x100%
31.20
= 57.69%
Percentage of toluene = 2 x100%
31.20
= 6.41%
Percentage of
water = 100%- 57.69%-6.41%
= 35.90%
Solution H
Percentage of
ethanol = 19x
100%
36.25
= 52.41%
Percentage of toluene = 1 x100%
36.25
= 2.76%
Percentage of
water = 100%- 52.41%-
2.76%
= 44.83%
Triangular
Diagram Plotted:


DISCUSSION:
For a three-component systems, the
composition of all three phases can be expressed in the ternary phase diagram.
Each side of the triangular diagram corresponds to one of the three components
in the system. By following the phase rule, that is applied for prediction
number of stable phases may exist in equilibrium for a particular system, it is
determined
that a single phase in three components system may possess four degree of
freedom.
F = C P + 2
P + 2
= 3-1+2
= 4
where F
= degree of freedom
C = number of
components
P = number of phases
Since there are four degree of
freedom, there are four
intensive variables, which
are pressure, temperature and two out of three concentration of the components, may vary
independently to achieve the equilibrium. By fixing the temperature at room temperature and the pressure at 1 atm,
only the concentration of two out of three components are
required to define the system at equilibrium as the concentration of the third
component can be known by subtracting the concentration of the first two
components given from the total concentration.
In this experiment, water is added into
the ethanol-toluene mixture, and the solubility of ethanol in water and toluene
in water are markedly different. Toluene is insoluble in water while ethanol is
soluble in water due to the presence of hydroxyl group. The mutual solubility of the
original homogeneous
pair (ethanol and toluene) is decreased when water is added into the system.
Therefore, cloudiness is observed due to the presence of two-phase liquid.
From the experiment,
the water and toluene usually form two-phase system as they are just partially
miscible. However, ethanol is completely miscible with both water and toluene,
therefore it is expected
to act as a surfactant and the increased concentration of ethanol in the
partially miscible, two-phase system of toluene and water would eventually
produce a single-phase where all 3 liquid are miscible. Hence, with sufficient
amount of ethanol in the toluene-water system, a single-phase system is
produced where all the components are miscible and the mixture is homogeneous.
This is shown in the ternary phase diagram that has been plotted in the
triangular diagram.
From the triangular diagram, the curve of
the plotted graph is known as binodal curve, or simply binodal. The region
bounded by the binodal curve indicates the two-phases region while the
region above the curve shows one-phase region of homogeneous
solution. The mixture within the bounded region appears cloudy because there is a phase
separation due to the insufficient amount of ethanol to produce homogeneous
mixture. Meanwhile at the upper region, the addition of ethanol allows the two-phase solution
to be in one phase.
As shown in the triangle, we can see the
binomial curve is incomplete and no tie line is obtained as there may be some errors
encountered during the experiment. One of the errors is the degree of
cloudiness. There is wide range of cloudiness that students get confused whether to stop the
titration of water or not.
Students do not have specific requirements
for the degree of cloudiness in the experiment. Different degree of cloudiness
is achieved because the addition of water is done by different person. This
contributes to an excess amount or insufficient amount of water to be added and will affect
the result obtained. Besides,
the second error is parallax error. Our
eyes must be parallel to the meniscus position when taking reading on burette
or pipette to ensure
the volume taken and recorded is accurate. Next, the volatility
of the chemicals also leads to the error. This is because the mixture of
toluene and ethanol may vaporise when
left unsealed
and the measured volume may be less than
the actual volume that has been measured earlier. This will affect the total
volume of water needed during the titration. In addition, the conical flask is
not completely dried before the titration. This may result in slight dilution
of the mixture and may
affect the result obtained. In obtaining a good result,
precautions need to be taken to minimize the errors.
QUESTIONS :
- Does the mixture containing 70% ethanol, 20% water and 10% toluene (volume) appear a clear or does it form two layer?
Following the phase diagram, at these
concentration, the solution appear clear.
- What will happen if you dilute 1 part of the mixture with 4 parts of (a) water (b) toluene (c) ethanol ?
1 part × 70% ethanol = 1 part × 70/100 = 0.7 part of ethanol
1 part × 20% water = 1 part × 20/100 = 0.2 part of water
1 part ×10% toluene = 1 part × 10/100 = 0.1 part of toluene
(a)
1 part of mixture+4
parts of water


According to the phase diagram drawn, this mixture lies
outside the area bounded by
the binodal curve. Therefore, a clear homogeneous liquid phase of solution is formed.
(b)
1 part of mixture + 4 parts of toluene


According to the phase diagram drawn, this mixture lies
outside the area bounded by
the binodal curve. Therefore, a clear homogeneous liquid phase of solution is formed.
(c)
1 part of mixture + 4 parts of ethanol


According to the phase diagram drawn, this mixture lies
outside the are bounded by
the binodal curve. Therefore, a clear homogeneous liquid phase of solution is formed.
CONCLUSION
:
Phase diagrams are graphical representations of the liquid,
vapour, and solid phases that co-exist at various ranges of temperature and
pressure within a reservoir. A ternary
phase diagram represent the phase behavior of mixtures containing three
components in a triangular diagram. Toluene, ethanol
and water system is a ternary system with one pair of partially miscible liquid
( toluene and water). The two phase system is said to be established once the cloudiness is observed. This shows that water and toluene
are only slightly miscible. The
addition of sufficient amount of ethanol to the toluene-water system is able to produce
a single liquid phase in which all the three components are miscible and the
mixture is homogeneous.
In
conclusion, the objectives of the experiment
are achieved. The solubility limits in a ternary system of water and two other
liquids (ethanol and toluene) are determined. The concept of construction of
the solubility curve of the system being studied on triangular diagram and
concept of miscibility and phase diagram for three-component system are
understood. Lastly, Phase Rule are used to relate to the use of triangular
coordinates to know the mutual solubility of liquids in a two phase system.
REFERENCE :
1. Martin's Physical Pharmacy and Pharmacautical
Science, Sixth Edition, Patrick J. Sinko, Wolters Kluwer, Lippincott Williams
& Wilkins.
2. Physicochemical
Principles of Pharmacy , 4th edition (1998) . A.T. Florence and D.Attwood. Macmillan Press Ltd.
No comments:
Post a Comment